Coinbase Dominates U.S. Crypto Market Share
Subscribe to Kaiko’s weekly research newsletter here.
- Price Movements: Curve and Uniswap V3 display highly efficient price discovery for stablecoin pairs, comparable to centralized exchanges.
- Volume Dynamics: Binance and FTX’s regulated U.S.-based affiliates have struggled to gain market share against Coinbase.
- Order Book Liquidity: Bitcoin market depth has recovered after dipping to 8-month lows in December.
- Derivatives: Perpetual futures funding rates re-set to neutral as BTC trades steadily above $42k.
- Macro Trends: U.S. inflation climbed 7.5% in January, hitting four-decade highs.
Kaiko Research is hiring! Learn more here.
Price Movements
Bitcoin holds steady above $42k following Super Bowl.

Cryptocurrency markets remain at a firm neutral, with Bitcoin holding steady above $42k despite closing down for the week following a crypto-dominated Super Bowl. Last Thursday’s inflation print, showing a 7.5% year-on-year jump, spooked both traditional and cryptocurrency markets as traders priced in the prospect of a rapid interest rate hike. Beyond the (increasingly) usual macro-induced volatility, the cryptocurrency industry was riveted by news that $3.5B in stolen Bitcoin had been recovered by U.S. law enforcement from an unlikely duo. In another unlikely pairing, Binance invested $200 million in Forbes, a publication it once sued for defamation. Finally, KPMG — one of the largest auditors in the world — announced it will add Bitcoin to its balance sheet.
Stablecoin price efficiency is uneven across DEXs.

Liquidity is extremely important for stablecoins in order to maintain their 1:1 USD pegs. On centralized exchanges, the price discovery process for stablecoins occurs across hundreds of markets and direct USD pairs, supplied with abundant liquidity by market makers. On DEXs, stablecoin pools are some of the most popular liquidity pools, although there is greater risk of de-pegging due to low liquidity, slow transaction times, and the lack of direct USD markets.
For example, on January 28th, the stablecoins Terra USD (UST) and Magic Internet Money (MIM) suffered a liquidity crisis on major DEXs, causing both to de-peg as traders rapidly dumped their holdings. To get a better idea of DEX stablecoin liquidity, we chart the 15 minute volume-weighted average price (VWAP) for four USDC-USDT liquidity pools, which boast some of the highest volumes across all DEXs.
We observe that the USDC-USDT price varies the most on Sushiswap and the least on UniswapV3. Sushiswap has relatively low volumes and trade counts, which suggests arbitragers are not behaving as expected to maintain the 1:1 peg. Curve is a DEX optimized for stablecoin swaps and is a close competitor with Uniswap V3, and both stablecoin pools showcase low volatility, indicating highly efficient price discovery.
We can also observe how Uniswap’s upgrade from V2 to V3 strongly affected price efficiency. The introduction of “concentrated liquidity” for V3 alongside .01% fees enabled highly efficient stablecoin pools that allowed the DEX to become a formidable competitor to Curve.

How does DEX stablecoin liquidity compare with CEXs? We charted the highest volume USDC-USDT pairs to get an idea of how the CEX price discovery process varies. Overall, liquidity for the same stablecoin pairs show less variation on CEXs, with the exception being Okex. However, the magnitude of price swings on Uniswap V3 and Curve are similar to Binance, KuCoin, and Kraken, suggesting that DEX liquidity has matured significantly and is now comparable to that of CEXs.
Bitfinex’s exchange token breaks all time high.
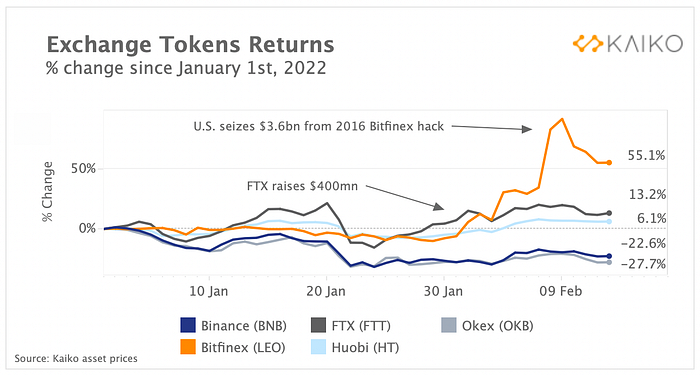
Last week, we showed that exchange tokens — cryptocurencies issued by exchanges that enable holders to benefit from lower transaction fees, vote on new coin listings, and earn passive staking rewards — have outperformed other sectors of the crypto industry since the start of the year. To better understand this trend, we chart the tokens of Binance, FTX, Huobi, Bitfinex and Okex. While exchange tokens bring tangible benefits for holders, they also serve as a gauge of success for exchanges and are often correlated with news events.
Bitfinex’s LEO token and FTX’s FTT have registered the strongest gains since the start of the year, rising by 69% and 18%, respectively. Bitfinex’s LEO hit an all-time high last week after the U.S. Justice Department seized nearly $3.6bn from the 2016 Bitfinex Hack. The token was originally issued to refinance Bitfinex following the hack with the promise that if the funds are recovered, the exchange would use them to buy back the tokens and destroy them. FTX’s token made gains after the exchange’s recent $400mn funding round, which brought its valuation to $32bn.
Volume Dynamics
Average trade size on Curve breaks $1 million.
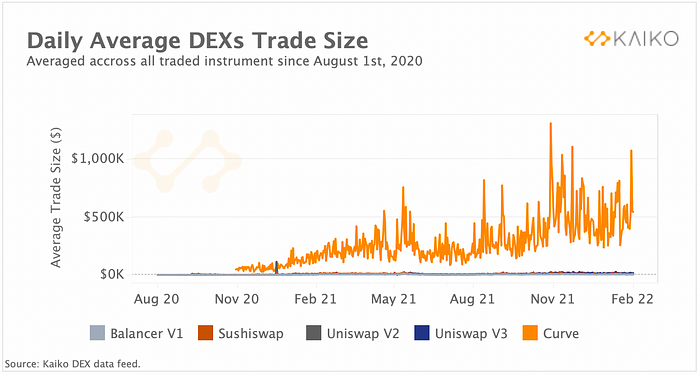
Curve is one of the most popular decentralized exchanges for stablecoin swaps due to its unique liquidity mechanism that enables more efficient price discovery compared with its competitors. The DEX attracts large traders seeking to swap stablecoins without the risk of slippage, and today possesses the highest average trade size taken across all liquidity pools. In November, Curve’s daily average trade size broke $1 million for the first time, and now remains far above its 2021 average.
Overall, trade volume on Curve remains relatively low compared with other DEXs, but it has found a niche in large stablecoin swaps. Despite a relatively low market share of volume, Curve holds the largest share of DeFi total value locked (TVL) on Ethereum (13%) — more than twice Uniswap’s TVL.
Other DEXs in comparison have minuscule average trade sizes ranging from $5-$25 thousand dollars, although they are far higher than CEX trade sizes. High Ethereum transaction fees make trading on DEXs prohibitively expensive for many retail traders, contributing to high trade sizes.
Coinbase’s market share soars as exchanges battle for regulated U.S. market.
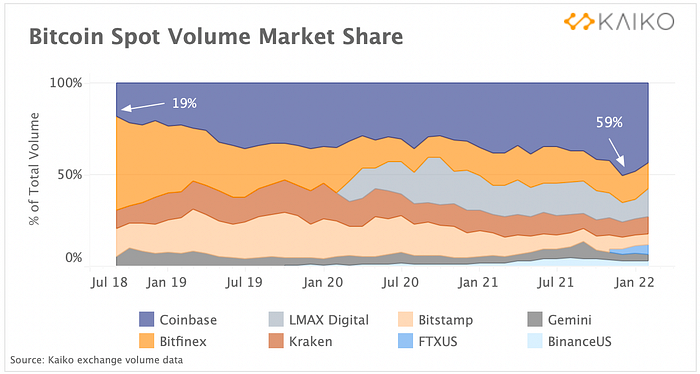
The competition for the vast U.S. cryptocurrency market is heating up as global behemoths like Binance and FTX launch regulated U.S.-based affiliates designed to cater for a more institutional type of trader. We take a look at Bitcoin-Dollar spot market share on major regulated exchanges, and can observe Coinbase’s market share recently hit an all-time high of nearly 60% in December, before retreating to 51% in January. The spike was due to strong trading activity on Coinbase’s BTC-USD markets during the Omicron sell-off and low-volume holiday season. Bitfinex’s market share has undergone a strong decline from over 50% in 2018 to just 14% in 2022. By contrast, LMAX Digital and Kraken have mostly managed to maintain their share.
Despite investing aggressively in their U.S. expansion over the past months, Binance.US and FTX.US are still relatively small in terms of trade volume. However, FTX.US appears to be gaining a bit of traction, exceeding Binance.US (3%) and Gemini (4%) in just a few months.

Order Book Liquidity
Bitcoin market depth recovers after December slump.
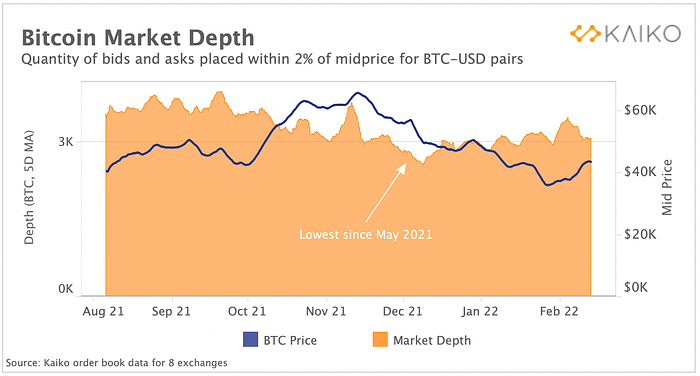
Bitcoin’s market depth has improved over the past month after falling to 7-month lows in early December. Above, we chart the quantity of bids and asks within 2% of the mid-price in native BTC units aggregated across 8 exchanges. We observe that Bitcoin market depth trended downwards since August, but the trend reversed at the end of December. Throughout January, market depth climbed steadily despite Bitcoin’s falling price, suggesting that market maker liquidity is building back up. Overall, trade volumes have been significantly lower over the past few months, which could explain the drop in liquidity.
Spread volatility is down in 2022.
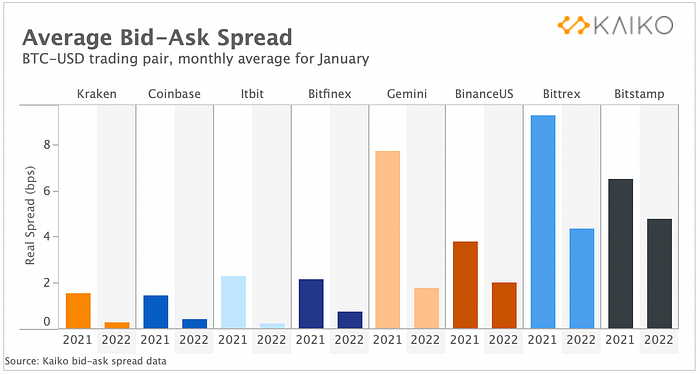
Despite bouts of volatility throughout the last month, liquidity as measured by the average bid-ask spread is far more stable compared with one year ago. Above, we chart the average bid-ask spread on major exchanges in January 2022 and January 2021. Last January was one of the most volatile month’s in Bitcoin’s existence marked by a record setting bull run and several sharp pullbacks that caused spreads to spike considerably. One year out, we can observe that markets are overall a lot calmer on every exchange. Bittrex and Gemini registered the strongest decline in average spreads of over 5bps.
Derivatives
Funding rates return to neutral.
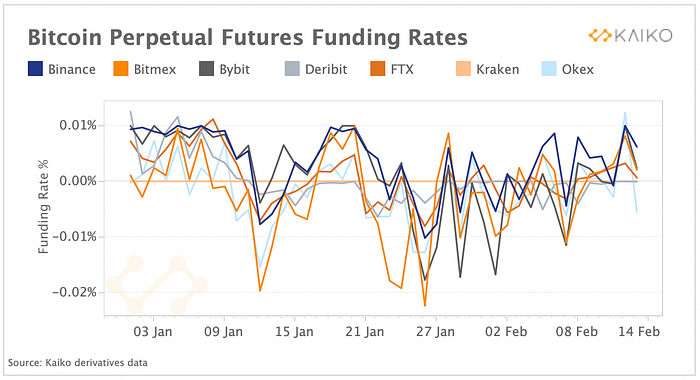
Bitcoin’s perpetual futures funding rates have re-entered neutral territory after turning negative and hitting their lowest level since January’s sell-off. Funding rates are the cost of holding a long position and a gauge of overall market sentiment and bullish demand. When they are negative it means that shorts are paying longs to hold their position and bullish demand is muted. Funding reset to neutral in early February on all exchanges except Okex. Bitcoin perpetual futures open interest remained relatively stable, hovering around $9bn, which suggests leverage is relatively low.
Meanwhile, the put-call ratio continued to rise over the past week, suggesting sentiment is skewed bearish in options markets.
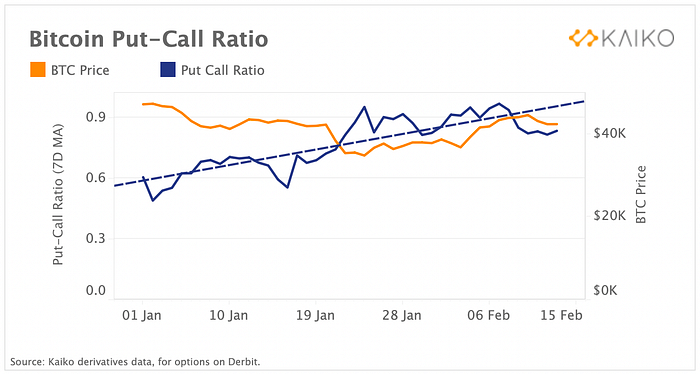
The ratio is calculated by taking the ratio of traded volumes for puts (bearish bets) and calls (bullish bets), and when rising it suggests demand for bearish bets is increasing. Demand for puts has been increasing relative to calls throughout last month, as traders sought protection against volatility and falling risk sentiment.
Macro Trends
Inflation hits 40-year highs.
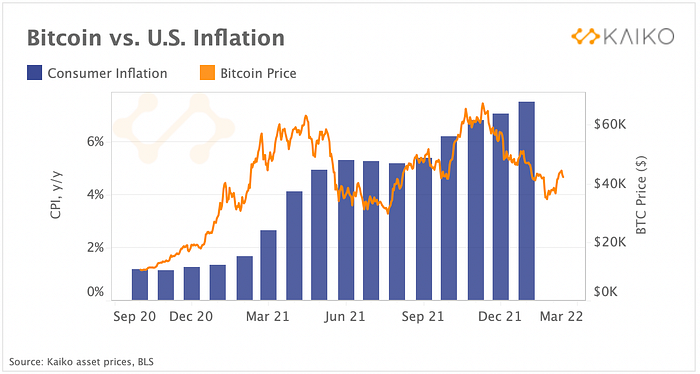
U.S. inflation climbed 7.5% in January, hitting another multi-decade high and showing little signs of easing. The increase exceeded market expectations and was driven by both rising goods and services costs, a sign of broadening inflationary pressures. We can observe that BTC has been moving in tandem with rising costs for most of last year before decoupling in November. While inflation continued surging, crypto assets tumbled alongside tech equities as the U.S. Fed took a hawkish shift — retiring the term “transitory inflation” and starting to taper its monthly bond purchases.
Despite Bitcoin’s correlation to equities moving slightly down over the past two weeks, the overall macro backdrop appears negative for risk assets. Hot inflation numbers and tightening labor market support the case for an aggressive 50 bps Fed hike in March instead of the standard 25bps move. However, as global central banks are moving towards exiting pandemic-era monetary stimulus in a more synchronized manner, fears of a policy error — tightening into a slowdown — are mounting. U.S. consumer sentiment fell to its lowest level in 10 years in early February, suggesting demand is already weakening.
Volatility roils equity markets as tightening fears rise.

The Fed’s hawkish pivot and surging inflationary pressures resulted in stronger market volatility for equities over the past few weeks. Above we chart the 20-day rolling volatility of Bitcoin, Ethereum and major U.S. stock indexes. We observe that both Bitcoin and Ethereum volatility spiked in January but remained lower compared to the summer. By contrast, volatility of both the tech-heavy Nasdaq 100 and the broader S&P 500 has been rising steadily since early July, as traders went from expecting near zero to as much as seven rate hikes in 2022.
Thanks for reading!
Written by Clara Medalie and Dessislava Aubert
