Sell-Off Continues Following Liquidation Cascade
Subscribe to Kaiko’s weekly research newsletter here.
- Price Movements: Markets closed the week down double-digits following the abrupt sell-off on September 7th.
- Volume Dynamics: Several exchange reported downtime after posting the highest daily volumes since May.
- Order Book Liquidity: We explore how liquidity evaporated during the worst of the sell-off.
- Derivatives: Ethereum open interest surged to all time highs before collapsing.
- Macro Trends: Real yields for U.S. treasury bonds have flipped negative as crypto lending takes off.
Stop by Kaiko’s booth this week at Blockworks’ annual Digital Asset Summit (NYC)!
Price Movements

We’ve seen this before. Bitcoin and Ethereum closed the week in the red after yet another price crash precipitated by cascading long liquidations on crypto derivatives markets. Liquidations can create a waterfall-like effect in spot markets, which are highly integrated and sensitive to derivatives movements. Even though several major exchanges have decreased the leverage offered on their platforms since May’s market turmoil, over $3.1bn of long positions were liquidated over 24h (Sept 6–7) according to data from the Block. A series of negative news stories contributed to the bearish market sentiment with the U.S. Securities and Exchange commission threatening to sue Coinbase over its proposed lending program and mounting concerns surrounding El Salvador’s adoption of Bitcoin and its effect on the country’s U.S. Dollar reserves.

Tether surges, USDC holds steady during crash. Price crashes often have a de-stabilizing effect on stablecoins and we can observe that Bitcoin’s 10% plummet caused a brief spate of volatility for Tether. During a sell-off, traders will often rotate funds into stablecoins which are considered safe havens in times of volatility. This can rapidly increase buying pressure for stablecoins like Tether and USDC, which are designed to maintain a 1:1 peg to the U.S. Dollar. Tether’s price vs. USD briefly spiked above $1.001 during the worst of the sell-off, while USDC did not undergo any unexpected price movements.

A temporary V-shaped recovery. This price crash had a uniquely strong V-shaped recovery as traders aggressively bought the dip following the initial drop. In the six hour period from 12pm UTC to 6pm UTC, Solana experienced the steepest decline, dropping 20.2% during the crash compared with Bitcoin and Ethereum’s 10% and 12% drop. The pain didn’t last long for Solana, which closed the day up 6% and broke new all time highs the very next day. Other crypto assets also experienced a rapid bounce following the crash, but ultimately failed to fully recover by week’s end. The V-shaped price curve suggests that the crash was exacerbated by forced liquidations, which didn’t necessarily match market sentiment at the time of the drop.
Volume Dynamics

Highest daily volume since May causes exchange downtime. Volumes have been relatively lackluster across exchanges since late spring, hovering between $1-$2 billion a day. Price crashes almost always cause volumes to surge, and that’s exactly what happened last Tuesday during the market-wide sell-off. Bitcoin and Ethereum-USD pairs aggregated across 12 of the largest fiat exchanges saw their highest daily volume since May. The volume caused several exchanges to suffer infrastructure issues with Coinbase reporting “degraded performance” along with Kraken, Gemini, and several others. May 19th, the highest volume day ever recorded, caused infrastructure issues on nearly every major exchange. The problems faced by exchanges on September 7th were far less severe, but still proves that exchange infrastructure has a long way to go before matching the robustness of traditional finance.

Ethereum trade sizes trend upwards in August. The average trade size for ETH-USD markets has increased on nearly every exchange over the last month following surging demand for Ethereum after its long-anticipated London Hard Fork upgrade along with record high volumes for NFT marketplaces which operate on the network. Above, we chart the average ETH-USD trade sizes across major exchanges. On Coinbase, the average trade rose from ~$1.8k to ~$2k in August, on Kraken, it grew from ~$4.1k to ~$4.6k. On Gemini it surged by 52% from ~$1.6k to ~$2.5k. On LMAX Digital, an exchange catering to institutional traders, the average ETH-USD trade size exceeded ~$5k for the first time since June.
Average trade sizes still remain below all time highs, but their recent uptrend could be a bullish sign for Ethereum. The average trade size does not reflect the actual size of trades, which are typically broken apart into smaller orders when placed by institutional traders. However, ATS does give an idea as to general sentiment surrounding an asset, and we have found a significant correlation between bullish price movements and the trade size for an asset.
Order Book Liquidity
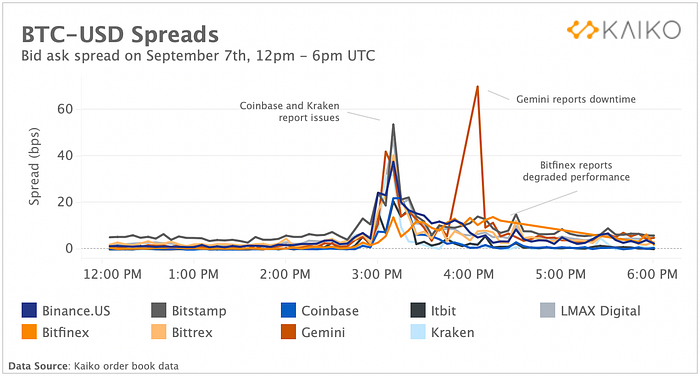
Exchanges suffer as liquidity evaporates. It’s always fascinating looking at order book data during a price crash. Order books reveal the underlying liquidity for a trading pair in the form of bids and asks, which represent the ever-changing supply and demand for an asset. The BTC-USD pair is one of the most liquid in crypto, but even so is not immune to liquidity crises during a crash. Above, we chart the bid-ask spread (the difference between the best bid and best ask on an order book) for BTC-USD markets in 5 minute intervals before, during, and after the crash.
The data is as staggering as ever. On Bitstamp and LMAX Digital, spreads shot up to nearly 50 basis points during the peak of the crash. On Gemini, spreads surged past 60 as the exchange reported downtime. Bitfinex stopped emitting any order book data for several hours following an extended period of degraded performance. By 6pm UTC, the spread on most exchanges had stabilised but still remained higher than average.
To get an idea of why spreads skyrocket so rapidly, we charted the 1% market depth for BTC-USD on Coinbase. 1% depth measures the quantity of BTC within +/- 1% of the midprice. We can observe that both bid and ask depth approached zero during the worst of the sell-off (3:00pm UTC).
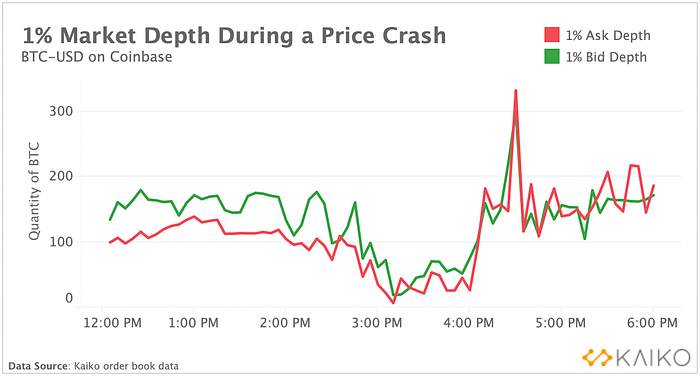
The complete evaporation of market depth occurs as market makers rapidly remove bids and asks from the book to avoid being caught in an unfavorable price swing. This causes spreads to skyrocket, which is exactly what happened on Coinbase as the quantity of BTC within 1% of the midprice (at the time, ~$45k) all but vanished. This can further exacerbate price swings until market makers re-enter markets.
Derivatives
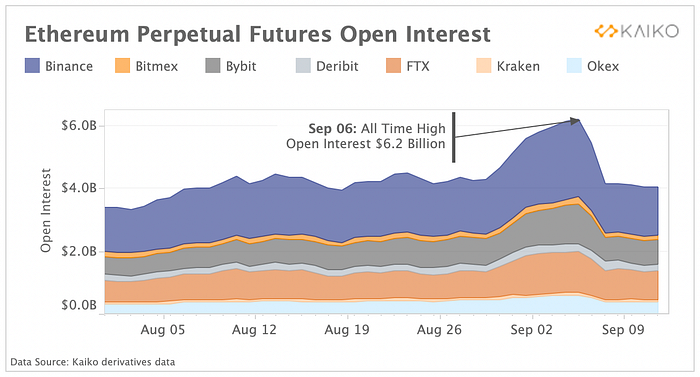
Ethereum open interest broke all time highs before crashing. Demand for Ethereum has soared over the past few months on both spot and derivatives markets. On September 6th, open interest aggregated across the leading derivatives exchanges broke new all time highs of $6.2 billion. Open interest reflects the outstanding number of derivatives contracts open on an exchange and can be used to gauge sentiment behind price movements. Rising open interest can be interpreted as a bullish sign for an asset, but can also make markets more susceptible to a liquidation cascade due to over-leveraging. That is exactly what happened on September 7th, and we can observe that open interest dropped precipitously throughout the de-leveraging event.
The flash crash was accentuated by the rapid unwinding of derivatives positions which had surged over the past few weeks. Traders generally enter into long derivative positions in expectation of a future price appreciation. However, if they are caught on the wrong side, they are forced to cash-settle their perpetual future contract. Failure to do so, would result in their positions getting force liquidated.
On September 7th, the daily liquidations of long positions exceeded $3.1 Billion. Bitcoin open interest also dropped precipitously throughout the market mayhem.
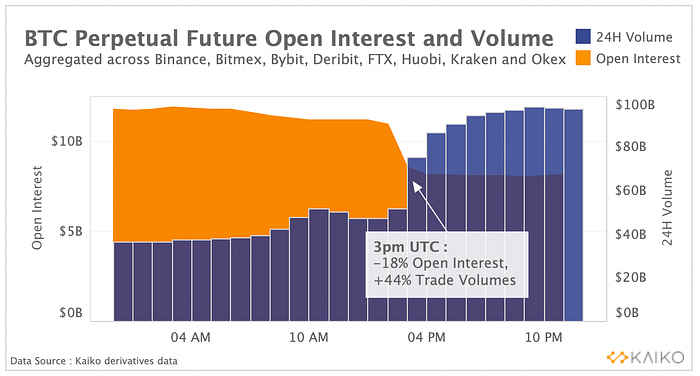
We chart the hourly evolution of open interest and trade volume of BTC-USD and BTC-USDT perpetual futures across major derivative exchanges and can observe that trade volumes surged by 44% as open interest plunged by 18% during the worst of the sell-off. However, we can observe that the change in open interest was not symmetrical across exchanges when looking at exchange-level data.
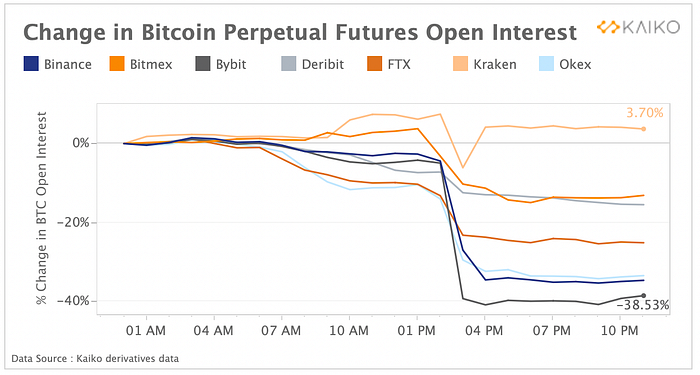
For example, open interest plunged around 40% on Bybit while open interest underwent a marginal increase on Kraken. The difference in the level of expertise of market participants and margin requirements on each exchange could explain this divergence. On Bybit, it is possible to enter into positions with 100X leverage while the maximum leverage is capped at 5x on Kraken.
Macro Trends

Treasury yields flip negative as crypto lending takes off. The U.S. Fed’s emergency monetary accommodation has put significant downward pressure on long-term bond returns over the past year. Above, we chart yields on 5-year, 10-year and 30-year inflation indexed U.S. Treasuries (TIPS). Yields on TIPS is equal to treasury bond yields minus the expected inflation rate. We observe that as global inflation increased and growth expectations worsened, real yields turned negative hitting their lowest levels since 2003 this past August. Fixed income assets have played an important role in a diversified portfolio over the past years, offering steady income flows, low volatility, and protection against falling equity valuations. However, as yields are drifting lower, the fixed-income allocation in the classic 60/40 portfolio (60% equities and 40% bonds) is likely to underperform.
In the current low yield environment and due to the rising demand for liquidity in crypto markets, the nascent crypto lending industry is gaining popularity among market participants. Crypto lending allows users to supply cryptocurrencies in exchange for earning an annualized return, even in the absence of price appreciation. A growing number of platforms including centralized exchanges such as Binance and Gemini offer crypto interest-earning programs which are increasingly becoming the target of regulators. These accounts offer sizable returns ranging from 3% to 12%. By comparison, the typical savings account pays a meager 0.7% per year in U.S. dollars.
Have any feedback? Email clara@kaiko.com with any and all suggestions!
Written by Clara Medalie, Dessislava Aubert and Arun Vignesh
